What My Retriever Taught Me about #ResearchPride

Anyone who knows me very well knows that I am crazy about Letty, my retriever mix.  I was crazy about her the day I adopted her, and I am still crazy about her now, more than two years since she passed away.  Though she is no longer a daily, physical presence in my life, not a day goes by that I don’t think about her or remember her in some way, usually many times each day.  She also lives on, of course, as part of the inspiration for the title of this blog.  As I explained in my second entry on this blog, my two dogs inspired the title because “I realized that the tasks their breeds excel in are also analogous to the sort of work I do for a living as a researcher and data analyst.”

Since March is #ResearchPride month, I thought this was as good a time as any to elaborate on some of the many lessons Letty taught through her example that have relevance to those of us working in the field of prospect development (and, frankly, many other fields, as well).

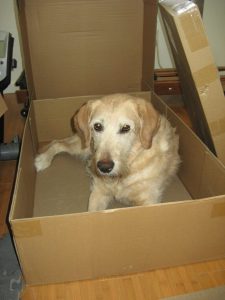
First, a bit of background about Letty:  I adopted her from the Nevada Humane Society when she was approximately a year old.  She was definitely a retriever mix, but whether that meant she was part Golden Retriever, part Labrador Retriever, or a mix of the two, I will never know for sure.  I will also never know what she was mixed with, though this was always a topic of speculation and discussion among those who met her or who saw her.   The dominant theory was that she was mixed with some sort of wirehaired breed–German Wirehaired Pointer, Wirehaired Pointing Griffon or Wirehaired Viszla–or with some sort of terrier, possibly Airedale.   Among other theories I’ve heard was that she could be a first generation Labradoodle, that she could have been part Irish Wolfhound, or Italian Spinone, and though she didn’t bear a physical resemblance to the breed, something about her eyes also reminded me a little bit of German Shepherds I have known.

IMG_0025-modified
Letty at two years old.

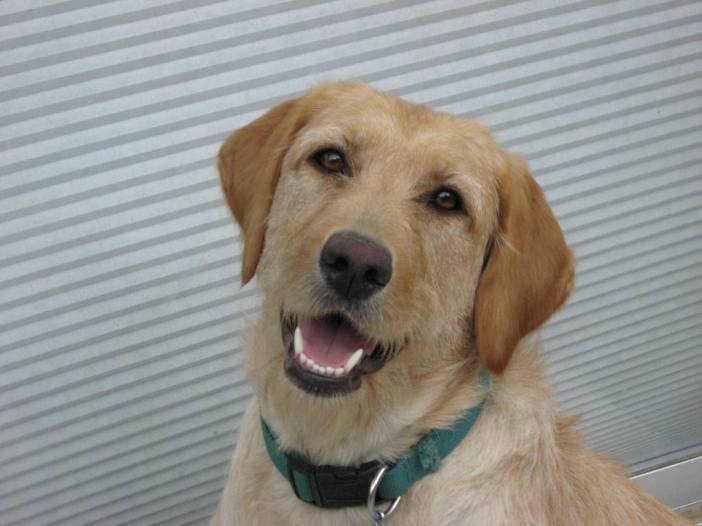
In some sense it didn’t matter because everyone saw something a little different in her.  She was sort of an “every” dog to whom many people could relate. Her coloring was a beautiful mix of golden and cream, she had a medium-length wiry coat, and a slightly scruffy looking face with a cute beard under her chin.  Her most striking feature was her intensely thoughtful, lively and spirited eyes that communicated both her zest for life and her intelligence.

So what were some of the things that Letty knew?

1). There is joy in retrieving.  Appreciate your treasures wherever and whenever you find them.

28826_1481375679659_8034654_n
Playing in the back yard.

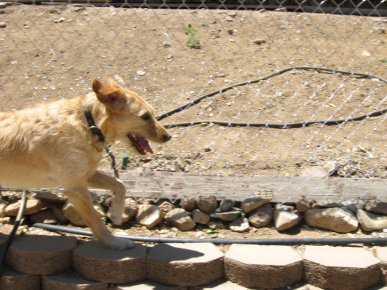
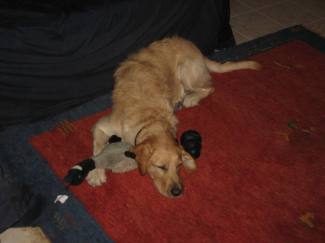
Like most retrievers, Letty loved fetching things (if she couldn’t catch them first), and she also loved carrying them around.  Some of her favorite toys were her stuffed birds.  Over the years, she had many different ducks, pheasants, geese, and even some roosters, not to mention squirrels, teddy bears, and even a cow and an alligator.  She got excited retrieving them, but she also enjoyed grabbing one or two to take downstairs with her every morning, napping near them during the day, or cuddling with them at night.

So how does this relate to research?  As implied by my blog’s name, research is largely the art of finding and retrieving information.  That often calls for a lot of creativity and effort, but sometimes it is just a matter of knowing where to look to find something quickly.   Either way, there is much satisfaction to be found in finding the answers to many kinds of questions.

2). Hang out where you’ll find the good stuff.

468266_3466704951650_539359162_o
Letty always loved cleaning out the dog food bags after I transferred the food to a storage bin.

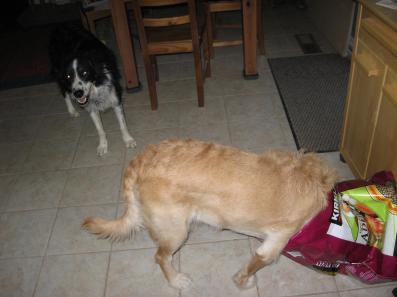
When I was working in the kitchen, Letty was often sitting or lying nearby.  She knew that was where the food was, and if I was chopping or cooking something, she knew that eventually I might drop something that she could eat, or if she looked at me the right way, she might be able to persuade me to give her some bits to snack on.

In time, Letty became even more observant about my kitchen rituals.  She noticed that I often left yogurt containers near the sink in the morning after breakfast, so I could clean them out for recycling or reuse for other purposes.  And even though she knew she wasn’t supposed to “counter-surf,” she recognized that after I put the containers there, I would often walk down the hall to brush my teeth or go about some other part of my morning routine.  She figured out that she could go partway down the hall with me, but then she could turn around and go back to the kitchen to grab the yogurt container off of the counter and enjoy any remnants of yogurt left in the container.  The first time or two this happened, I was puzzled as to how the yogurt containers ended up on the floor in the kitchen, but then I noticed some bits of yogurt on the fur on her face and figured out what she was doing.  One day, I walked quietly back towards the kitchen and caught her nabbing the yogurt container from the counter.  I started just giving her the yogurt containers after I was done with them.

And research?  As experienced researchers and data analysts know, much of research is done incrementally through observation, recording information, and data tracking.  Some days seem very slow, and only over time do we realize how much information we’ve gathered and how useful it is when we put it all together.

3).  Problem solving is always important (or don’t be afraid to move things around).

Some of my favorite stories about Letty come from my first year with her.  I had a dog door installed in the garage, and for the first few months, she was free to roam around the garage during the days and to go out the dog door into the yard.  During those days, I was often surprised by what I came home to find.  One time I had a bag of magazines and catalogs in the garage that I intended to put out with the recycling and Letty found it.  I came home that afternoon to discover that Letty had been reviewing magazines and catalogs all day, as they were strewn all over the deck and yard in the back of the house.  There was also an old part of a rug in the garage that I used for a mat near the door.  On several occasions I returned home to find that Letty had moved it to the deck, as well.  Clearly she didn’t like it placed where I thought it belonged.

By far the most remarkable instance of problem solving, though, was the day I returned home to find a broom on the deck.  How she figured out how to pull a broom through the dog door, I will never know.  It may have taken her a lot of effort, and perhaps she spent much of the day thinking about it, but she was such a clever pup, that it’s equally possible she could have come up with a workable approach in short order.

IMG_0539
Of course the best snow is to be found on the patio table!

As researchers, we need to recognize that problem-solving often requires moving things around and looking at things from different angles. Some tasks may seem insurmountable when we first conceive of them, but we can eventually find the answers by breaking them down into different components and testing out various theories as we go.  As Letty clearly demonstrated, a broom can be pulled through a dog door if you can figure out the right way to do it.

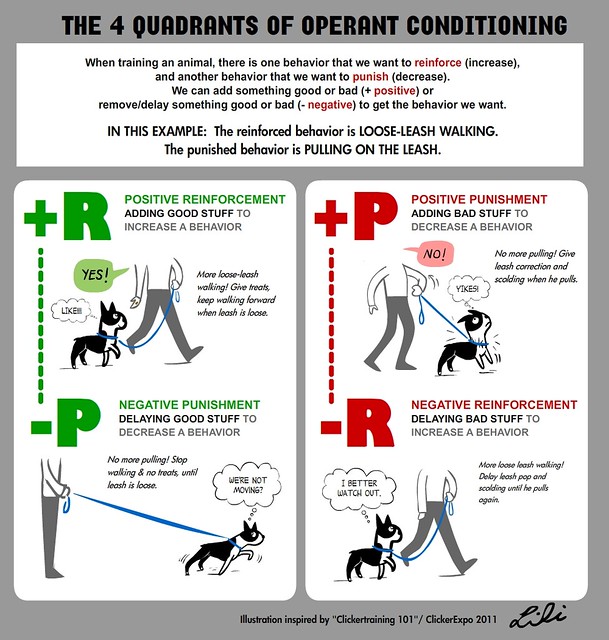
4).  Learning new things can be lots of fun.

A few years ago I wrote a post about what I learned about operant conditioning after I adopted my dogs.  Although I didn’t say so in the post, much of what I learned came about as a result of my frustration with traditional dog training classes.  I started Letty in a traditional dog obedience class offered by the city department of parks and recreation.  She made decent progress there, but I kept looking around for other alternatives.  Once I started to read about clicker training and tried it with Letty, I was amazed to see how well she responded and how much fun she had in the process of learning new tricks and skills.  As soon as she saw me get out the clicker, she’d become excited and start offering up all sorts of tricks and skills she had already learned in the hope of getting more treats.  When I would try to get her to do new things, I always cherished the exuberance of her approach.

14264932_10209834950335732_4494697932627953806_n
Letty helping to assemble Ikea furniture.

The field of prospect development is very different now than it was when I started out many years ago.  Over my career, I’ve benefited from the many conferences I’ve attended and connections I’ve made as a result, but these days there are many more avenues available for learning new things and developing one’s skills.  While one can look to the many offerings available through APRA, one hardly needs to stop there.  These days there are more and more books being published about different elements of prospect development, there are online platforms for learning about the field, and there are all sorts of other classes and workshops offered, many at little or no cost that can help people learn topics ranging from advanced statistical analysis to how to operate a key piece of software.

5).  Be observant and you may understand what people want without them explaining.

IMG_0219--modified
Napping with a Kong and a stuffed goose after a busy day of playing with other dogs.

Letty always loved playing with her Kong toys.  I would jam treats in the Kongs tightly, and, being the excellent problem-solver she was, she would always focus and persist enough to figure out how to get them out.  I would give her a Kong when I left the house, and I would pick it up to clean off and get ready for the next day when I got home.

One day, though, I returned home and couldn’t find the Kong in one of its usual spots.  Letty had only been living with me a few months at that point, and although I talked about the Kong, I figured it probably just sounded like so much blather and nonsense chatter to her.   I looked around for a while and asked, more or less rhetorically, “Where is the Kong?” when, much to my amazement, Letty ran outside and retrieved it from where she had left it, just under the deck.

The longer one works in the field of prospect development, the more one can recognize what sorts of information may be most useful, whether people ask just ask rhetorically, or sometimes even if they don’t know what to ask for.  We can ask questions to guide them, we can suggest possibilities, and sometimes we know just what sort of information will provide the answers to the questions that they’ve only just begun to formulate.

IMG_2371
Glad to be home and enjoying the view.

In closing, here’s a question for discussion:  what life or work lessons have you learned from your pets?

What’s Life Like in Nevada?

Last week I was too focused on completing the final requirements for my MBA to write any new blog posts.

To start things off this week, I thought I’d post a piece I wrote a year ago for my college class newsletter.  The newsletter editor invited me to submit a piece telling my classmates more about my life in Nevada.

I used it as an opportunity to speak to those who think there’s not much in Nevada except Las Vegas and Sagebrush.   It’s actually timely for me this week, too, because 12 years ago this week, I became a resident of Nevada.  I’ve illustrated the text with some photos I’ve taken in various areas in the state.

  • First things first: it’s Nev-a-da, not Ne-vahda.  The name is Spanish for snow-covered, but the pronunciation is Americanized, just like the communities named Verdi (Ver-dye) and Genoa (Ge-Noah).

    Nevada's Oldest Saloon, Genoa, Nevada, October 2009
    Nevada’s Oldest Saloon, Genoa, October 2009
  • Second, a word about scope: Washoe County, where Reno is located, is larger than the state of Connecticut.  Clark County, home of Las Vegas, is slightly smaller than the state of New Jersey.  Google maps calculates the driving distance from Reno to Las Vegas as 438 miles, (the same as the driving distance between Washington, DC and Boston, MA).  Needless to say, the two places are very different, and they represent just two parts of Nevada.  Remove Washoe and Clark Counties and the area of the remainder of the state is slightly smaller than Oregon, but with a population less than 2/3 that of Wyoming.

    Hiking In Little High Rock Canyon, June 2005
    Hiking In Little High Rock Canyon, June 2005
  • Third:  If you’ve driven across or flown over Nevada, you probably think of the state as a vast, empty sea of sagebrush and brown and dusty deserts with few trees.  In reality, when you get off the highway and into the fabric of things, you discover that the wild areas (and the more than 300 mountain ranges) are surprisingly diverse, and as unexpectedly fascinating as the state itself.  Nevada is paradoxically one of the states with the lowest population density and it is also one of the most urbanized states in the country. 
Looking down The Strip from the Cosmopolitan

Las Vegas is opulence and glitz, The Strip, but also the sprawling city beyond the casinos, shows, shops, restaurants, and people aggressively distributing flyers on the street: it’s  hot traffic jams, countless developments (built and unbuilt), Red Rock Canyon and Mount Charleston, with Lake Mead and Hoover Dam a bit further afield.

Late Snow in Reno, May 2011

The Reno-Tahoe area includes not just Reno and Sparks, but also the Nevada side of Lake Tahoe,  Carson City, the state capital, and to the east, the historic mining town of Virginia City.  Reno is old Victorians, river-front mansions, 20s and 30s era bungalows, and suburban-style neighborhoods dating from the post-war years through the present day.   Reno was Las Vegas before Las Vegas, but since most of the gaming action has moved elsewhere, the city now markets itself as a destination for outdoor recreation and the arts, as a university town and a place for tech companies seeking a location.  It’s the Truckee River, Lake Tahoe, hiking, biking, winter sports, and sunshine.  It’s Artown,  summer concerts on the river, an international chamber music festival, farm-to-table restaurants, cafes, microbreweries, balloon races, and classic cars.

Lake Tahoe from the Mount Rose Trail

And then there’s rural Nevada: vast and mountainous, with a rough and unforgiving climate, but an astoundingly sensitive environment.  It’s a land of miners, engineers, geologists, ranchers, hunters, cowboys, poets, picon punch, the Paiute, the Shoshone, outdoor adventures, and best-laid-plans gone awry: ghost towns, and the playas of lakes dried up either by geologic time or by diverted water streams.  It’s wild mustangs, elk and big-horn sheep, Cuiui, wildflowers, petroglyphs, solar and geothermal, copper, silver, gold, remarkable sunsets, and solitude amidst broad vistas with cloudless, deep blue skies.

Sunset from the Air
Nevada Sunset from the Air

Shape and Click: What My Dogs Taught Me about Building Better Systems

Back in 2012, the speaker at the University of Nevada, Reno Foundation’s annual banquet was Charles Duhigg of the New York Times, author of the book The Power of Habit.  What he described in his talk (and in more detail in the book) had to do with why people do what they do over and over again, and how they can change old habits or learn new ones.  He outlined the system of “cue, routine, reward” as a means by which behaviors are continually reinforced, and he offered the following framework for change:

Identify the routine

Experiment with rewards

Isolate the cue

Have a plan

As I sat listening to his talk, I recognized what he was describing as essentially being what psychologists and behaviorists refer to as operant conditioning.

While I had been exposed to the idea of operant conditioning in classes before, though, the truth is that I hadn’t really thought through all of the implications of its practical applications until nine years ago, when I adopted a dog from the humane society.  I took her to training classes with varying degrees of success and looked for various resources online.  I sometimes heard people refer to “clicker training,” but didn’t know exactly what it was or how it worked until, after having done a little research, I bought a book about it online.

The book explained the theory of operant conditioning and said that clicker training had been used to train dolphins and other marine mammals.  The book also explained the idea of “shaping” and it described in detail the steps one could take to teach dogs various kinds of tricks.  I was intrigued, so I got a clicker and started trying it out.

Although technically all dog training is based on the theory of operant conditioning, as explained in the infographic below, clicker training is primarily a form of positive reinforcement, so it is focused on the left side of the quadrant.  By contrast, traditional dog training usually involves more of a mix of both positive reinforcements and positive punishments.

“The Four Quadrants of Operant Conditioning” by lilita (Lily Chin) licensed under CC BY-NC-ND 2.0.

Using the clicker as a form of positive reinforcement provides a way of communicating with the dog to encourage more of certain behaviors.  As the dog figures this out, he or she will start offering up all sorts of behaviors that have been rewarded in the past.

With a little creativity and patience, people can begin to figure out how to break behaviors down into manageable steps as a way of teaching the dog something new.  When you want to train a new behavior, you only reward the steps that lead to that behavior as a way of shaping a new behavior.  It certainly takes patience, but when applied regularly and diligently, it can achieve amazing results.

We’ve all heard the expression “herding cats,” but as demonstrated in the video below, clicker training can work for both dogs and cats as a way of shaping behaviors.

So what does all this have to do with the topics I usually write about: prospect development, data analytics, research, and management?  Everything.  If we can understand how to use positive reinforcement to shape and develop new behaviors in dogs or cats, then we can certainly think through its implications for ourselves and those we work with.

In an earlier post, I cited Scott Adams on the importance of systems over goals; I’m pretty sure that he’d agree that a good understanding of the applicability of operant conditioning to many situations is a necessary prerequisite for a good system.  One of the reason that the situations in his comic strip Dilbert are as amusing as they are is that the systems at work in Dilbert’s workplace are set up to reward the most peculiar things, and so those things keep happening.

How have you used operant conditioning to shape behaviors in the past?  Perhaps you’ve applied it in your own life, or to teach a dog or cat a new trick, or to train someone at work.  And if you’re not sure if you’ve ever consciously applied it before, can you think of some situations in which you would like to try it? I’m interested in reading your comments below.

The Beginning of Wisdom? Finding More Uses for Prospect Development Data

In his book of essays entitled Mortals and Others, philosopher Bertrand Russell wrote “To understand the actual world as it is, not as we should wish it to be, is the beginning of wisdom”  (Russell, 318).  The line concluded a short essay on censorship in education, but his point applies equally well to many sorts of situations.

While his point seems obvious enough when taken at face value, it is nevertheless rather astounding to think about how easily people cling to wishful thinking or half-truths rather than face the challenging realities of their own situations.  This is as true of organizations as it is of people.

In the world of development, part of the reason for the turn towards doing more with analytics is that, used properly, analytic techniques can be a great source of wisdom into the nature of the organization’s support.  And prospect development professionals are perfectly situated to help provide the understanding that can lead to such wisdom.

“Wisdom” by wtlphotos (Dr. Wendy Longo) licensed under CC BY-ND 2.0

The nature of this truth has become especially clear to me over the past six years or so, as my work has increasingly involved bringing forward insights drawn from analytics data about the nature of the prospect pool and the donor base at my organization.  The more I look at the data, the more questions I begin to formulate about it, and the more interested I become in the relationships among different variables.  As I start asking these questions and begin trying to answer them, they seem necessary and worthwhile, and yet the more I present my findings, I can’t help but notice a certain amount of resistance to them, as well.

Part of this is a matter of presentation format, and I expect that may change as I do more with data visualizations.  Graphs, charts, maps and other visualizations can tell a story better than a table or a spreadsheet can.

But beyond the matter of format, though, part of the resistance is also possibly the shock of the new, as I try to find ways of counting, classifying, and quantifying things that had not been quantified in that way before.  People are used to the metrics they have seen in the past, but combining different variables in an attempt to get a better understanding of the situation seems too abstract to some and threatening or unsettling to others.

One solution seems to be to limit what I report at first or to present it only in the most positive light and to let people draw their own conclusions before going further.

An alternate solution is to provide more data to those more willing to deal with it and then to use that experience to make the case for using more data in other realms, as well.

How have you dealt with these issues in your organization?  What have you found to be the best practices and best techniques for introducing more analytics data into your work?


It’s in the Hands: A Reflection on Forgotten Processes

Last weekend, I read an article from the New York Times about a pianist named Christina Kobb who had studied a number of 19th Century manuals about playing the piano, and who had, through  years of careful study and effort, replicated the technique that they taught.  Learning the technique required a lot of work and practice, as it was different than the way she had learned to play the piano, particularly the posture and the position of her fingers and her hands.

Christina Kobb Photo Credit: Fredrik Solstad for the New York Times.

Once she mastered the technique, though, she was amazed to discover that not only did it produce a different sound, but that it also had benefits in making some elements of playing a little easier for her:

As Ms. Kobb became more fluent in this approach, she found that certain movements — jumping quickly between disparate chords, for example — became swifter and more fluid. “The elbow against your body serves as a sort of GPS, so you always know where you are,” she said.

Chords and scales sound smoother and can be played faster, Ms. Kobb also found, and dramatic pauses between notes — often a matter of physical necessity rather than of style — are lessened. The old style also allows the performer to be more discriminatory and subtle in choosing which notes to stress, Ms. Kobb learned, producing a performance that is subdued by today’s standards.

I read the article a few days after my post about the future of profiles in prospect research, and it got me thinking about the common fallacy that evolution is the same thing as progress or improvement.  Most people recognize the fallacy when it is pointed out to them; nevertheless, I think some amount of what philosophers or historians describe as the problem of presentist thinking is also built into our culture.  When I was teaching, I would encounter this sort of attitude frequently among students who seemed to believe in an idea of progress and continual improvement, as though everything is better now than in the past.

In reality, it’s not necessarily better, it’s just different.  There is a tendency both to judge the past by present standards and to assume that various innovations and changes are improvements, when, in fact, they often come with unforeseen costs.

As much as I value the increased efficiency that information technology and the internet brings to my work, I can’t help but wonder sometimes if I’m thinking through things as systematically or as thoroughly as I would be if I had to use more manual or more laborious processes.  Writing things down, for instance, usually helps me remember them better than typing them.  Likewise, while I’m quite skilled at research with the internet and with modern databases, and while I’m sure I can easily find many things that I couldn’t have found without a lot of work a few decades ago (when researchers had to rely on card catalogs and indexes of periodicals), I also wonder if there are connections I’m missing or overlooking simply because our contemporary processes are so much more targeted.  For example, browsing in a bookstore is a fundamentally  different experience from shopping on Amazon.com; likewise, leafing through volumes in a reference room sometimes reminds one of other areas of inquiry that might not come to mind with a more precisely focused search.

I once read an interview with a writer (I have no idea who at this point), who had an unconventional recommendation for people interested in writing.  She recommended that people interested in becoming more skilled as writers should copy their favorite book, word-for-word by hand.  I’ve never tried her advice, but from experience, I know that it is easier for me to remember something when I write it by hand than it is when I type it, so I would speculate that the mental processes involved in each are different, too.

I’d rather do the work I do now with all of the modern conveniences and innovations than without them, but the article certainly made me wonder if we might not benefit by introducing more manual or traditional processes into our work from time to time.  It may sound silly or frivolous, but if undertaken on an experimental basis, it may turn out that reacquainting ourselves with traditional ways of doing things (or learning them for the first time) may provide us with some insights about how to do things better, or at the very least, may give us a renewed appreciation for the way we do them now.

What do you think?  Have you ever wondered about what you may have given up by adopting new ways of doing things or technological innovations?  Is there value in going back and learning older ways of doing things, or would it merely be a distraction?


Fun with Data Visualizations

The last two weekends have found me writing about data analysis and data storytelling, so I thought I’d continue the trend tonight with a look at some of the fun and interesting data visualizations I have come across recently.

Let’s start with the “Map of Literary Roadtrips” (hat tip: Flowing Data).  Richard Kreitner catalogued road trips taken around North America in twelve works of literature and then mapped them all using Google Maps.  This involved cataloging more than 1,500 entries from all of the different works.  You can single out individual trips to examine, or you can look at them all mapped on top of each other.  Click on the image below for a link to the website with the interactive map.


Elsewhere at Flowing Data we have a map of “sandwich place” geography around the contiguous 48 states.  The map shows where 19 national and regional chains are located, and then calculates the nearest sandwich place within a 10 mile radius of locations all over the country.  Not surprisingly, Subway (with 27,000 locations nationally) is the most dominant, but there is also a map without Subway which displays a bit more regional variety.

Perhaps you’d like some coffee to go with your sandwich?  Well, if you’re willing to hop across the pond, Information is Beautiful has created a Taxonomy of Hipster Coffee Shop names in and around London.  The graphic is designed in shades of brown and cream, with dark brown circles representing the classifications, and the size of each circle reflecting its popularity.  It turns out that the most popular group of names in London is names designed to sound like a Victorian establishment, such as Browns of Brockley, London Particular and St. David Coffeehouse.  The next most popular group of names appears to be the names that communicate brewing/production/craft, such as Tap, Artisan, and Grind.

Meanwhile, over at Visualizing Data, we have a post from just over two weeks ago, highlighting many great examples of data visualization from all over the web in May 2015.  One entitled “Endangered Safari” is particularly striking in its use of colors and animal images (facing either right to reflect stable or increasing population, or left to reflect decreasing populations) to reflect endangered status.  Click on the image below to go to the web page.

Perhaps  you are interested in doing more with data visualization yourself.  Well, as it turns out, at Visualizing Data, I also found a particularly helpful resource/collection post from late May of 298 data visualization resources.

Have you seen any particularly interesting or inspiring examples of data visualization recently?  If so, please feel free to share the links below.


Returning from a Conference: Six Steps for Avoiding Post-Conference Let-Down

Although I was not able to attend this year’s APRA conference in New Orleans, I’m not complaining, as I have been fortunate enough to have attended three conferences since July 2013.  One thing I’ve learned as a result of having attended many conferences over the years, though, is that the conference high can sometimes be followed by the post-conference let-down, as you return to your office and fall back into your old routine, or worse, you find that few are interested in the things you learned or the ideas you have for how to change or improve things.

So what is a newly re-energized employee to do?  The most important thing is to focus and to develop a plan.  That means you need to figure out what you learned at the conference that was most useful and most valuable, and then you need to figure out what you want to do differently and how you intend to implement those changes.

That last sentence said a lot rather abstractly, so below, I’ve broken it down into a list of steps you might take.

“New Orleans Lakefront Airport” by kevinomara (Kevin O’Mara) licensed under CC BY-NC-ND 2.0.
  1. As you travel back from the conference (or at some point before you return to work next week), review your conference materials, and decide on three key points or issues you’d most like to focus on in the weeks and months ahead.  Why three?  One might be sufficient if it’s a big change, but start by identifying a few key areas for improvement, and then prioritizing.  I don’t recommend many more than three, though, because it is easy to lose focus and become overwhelmed.
  2. With your three key issues identified, begin to figure out the steps you need to take to bring about those changes.  Is there anything you can change by yourself, just by modifying your routine?  Or do they require more of a long-term change that will require systematic changes around your division or department?  Maybe the items on your list are a mix of both.
  3. If the issues that interest you involve others in your division or department, identify some key allies with whom you can share your ideas.  Maybe they are colleagues who went to the conference with you, or maybe they are people who work in completely different areas of development with whom you have developed a good working relationship over the years.
  4. With your action steps in mind and your allies identified, begin meeting and making plans to implement some of your changes.  Part of this involves thinking strategically, and recognizing the challenges and obstacles you are likely to encounter, be they technical, political, or both.
  5. With the challenges and obstacles clearly identified, revise and expand your action steps with your strategy in mind.  Maybe one person on your newly-assembled team has a better relationship with a particular individual or department than you do, and you need the cooperation of that individual department to bring about more of a change.  Or maybe what you really need to do is to develop a better communication plan for getting your message out to more people in the division.
  6. Be focused and persistent; recognize that you’re working to improve the system, and that systemic changes often take time.  You might start out with one vision, but you might end up in a completely different place, and that’s o.k.  The important thing is that you are remaining engaged, that you are taking action, and that you are forging stronger relationships with others in your department and your division in the process, and hopefully, everyone is working together more effectively than before to further the goals of your organization.

What do you generally do to retain your enthusiasm and engagement after you return from a conference?  Have you followed steps like those above in the past?  Or maybe you went about things in a different way?  Please share your thoughts in the comments below.

Will Profiles Ever Be Obsolete?

When I attended my first APRA conference in Chicago in 2001, the responsibilities in my job at the time consisted mostly of writing lots and lots of research profiles.  I had written enough at that point, that I often wondered if there was a better way to do things.  With that context in mind, I listened attentively at one session as I heard Debbie Miller–who was, at the time, running the research department at Virginia Tech–describe how she had worked with her IT staff to design research reports that could be run from their database.  She said that there were some places for storing blocks of text in the database, but otherwise, the goal was for researchers to keep the many fields of the database up to date so that the report could be generated at any time and so there was no need to go in and write a new profile whenever one was needed.

This seemed like a revolutionary idea to me, one that could potentially change the focus of my work.  If I could work in a manner more akin to that she had described, then I could spent less time writing profiles and more time thinking about ways to identify prospects and to keep more prospect information up to date.

After the conference, I went back to my job where I still spent most of my time producing profiles and where it was nearly impossible to think about getting the database to produce the sorts of reports Miller described.  At the time, I worked with a database that was inflexible and difficult to work with, and as a researcher, I didn’t even have rights for much in the way of data entry, and querying and reporting were things that that only the IT people could do.

"profile" by JoséPedro (José Pedro Costa) licensed under CC BY-NC-ND 2.0
“profile” by JoséPedro (José Pedro Costa) licensed under CC BY-NC-ND 2.0

At some point after that–it may have even been at the next APRA conference I attended in 2002–I heard someone refer to “the death of the profile,” and mention that it had been a theme in some APRA presentations for a few years already.  I thought back on the presentation of a year before and wondered when that point would actually arrive.

Within another year, I was working at the University of Nevada, where the Raiser’s Edge database could be configured to produce something akin to the profile reports Miller described.  I didn’t stop writing profiles yet, though, and in fact, they remained a focus for the first three years of my time here.  As I mentioned in my previous post about the prospect research business model, I was able to find more efficient ways of working, though, and even though I came up with some plans for generating automated profiles from the system, for a variety of reasons, those plans have never been fully implemented.

Many years later, the profile is still definitely alive, but in many shops (including mine) it has entered a state of semi-retirement.  Profiles are still a definite responsibility for many of us, but many research offices have found ways to de-emphasize them or to see that they are only produced in special circumstances.

In my office, for instance, we produce far fewer profiles than we used to 9 or 10 years ago, but some people still expect them and probably always will.   In such cases, a profile provides the most effective way of presenting information about a prospect.  In other cases, though, we’ve done a lot over the years to educate our development directors about the different levels of research, and we’ve also done a lot to explain why a profile might not actually provide the answers to the questions that they really want to have answered.

While in some respects I would like to see the general prospect research profile head into complete retirement, one reason we haven’t dispensed with them completely in favor of more automated solutions is that they can communicate a lot more about the complexities and nuances of a given situation than a document which reports things more mechanically.  Sometimes it is helpful to explain the uncertainties which surround a given business, for instance, or the reasons why a particular rating is warranted, even though it may seem somewhat at odds with the established facts.

If you work in prospect development, are profiles still a key responsibility for your research office?  Or have they become something that is produced occasionally, but infrequently?  Would you like to see them become obsolete?  Why or why not?


Data Analysis Flyby: Selected Highlights from the Past Week

Last week, the spacecraft New Horizons flew by Pluto and took high resolution photos of the dwarf planet and its moons, giving a more detailed view of Pluto’s landscape, and revealing the presence of icy mountains as tall as the Rockies and a distinctive shape on the surface of the planet that is being called “the heart.”

Pluto is dominated by the feature informally called “the heart.”  Photo credit: NASA

In that spirit, I’d like to make today’s post a quick flyby of some of the interesting and useful articles and blog entries about data analysis that I’ve encountered over the past week.

From the perspective of better understanding the landscape of data analysis, I particularly enjoyed a post at the Abbot Analytics blog entitled “Data Mining’s Forgotten Step-Children.”  The post points out that two types of data mining get most of the attention.  The most talked-about by far is predictive modeling, also known as “supervised learning.”  The second most popular is clustering: “Despite being second banana to prediction, clustering enjoys widespread application and is well understood even in non-technical circles. What marketer doesn’t like a good segmentation?”

So, then, what are the “forgotten step-children”?  As the post explains, they include anomaly detection, association rule discovery, and data visualization.  From my perspective, as someone who has long been interested in data analysis but is still a relative novice, it is good to keep all of these in mind, as I learn more about different ways of working with and asking questions of data.

On that note, there is a helpful article at the Harvard Business Review called “Dispel Your Team’s Fear of Data”  by Thomas C. Redman.  He makes the point that many people have had bad experiences with data in the past, and that, partly because of those experiences, it was easy for many people to ignore data and analytics, but that has been changing.  Now more and more managers and their teams need to engage with data and to understand it, but before that can happen, they need to overcome their fear of data.

Redman suggests a few recent books that he finds useful and informative which might help people gain a greater appreciation for and understanding of working with data.  But what I really liked about his article was that it overlapped with some of the lessons from the “data storyteller” that I wrote about a week ago.  Redman suggests that people should practice finding more ways to work with data that interests them:

Then, find ways to practice using data. Pick something that interests you, such as whether meetings start on time, your commute time, or your fitness regimen, and gather some data, recording it on paper or electronically. Create some simple plots (such as a time-series plot) and compute some statistics (such as the average and the range). Ask yourself what the data means and explore its implications.

Finally, a third post guest-written by Matthew Scharpnick at Beth Kanter’s blog was noteworthy for relating the idea of “data storytelling” with one of the “step-children,” data visualization, and then tying both back to the nonprofit sector.  It is entitled “Five Tips for Nonprofit Data Storytelling.”  I recommend reading the post for all of the details, but the five tips boil down to: 1). Context is king, 2). Avoid unnecessary distractions, 3). Labels matter, 4). Strive for surprises, and 5). Be honest.

Did you come across any particularly interesting or noteworthy articles or blog entries about data analysis during the past week?  If so, please share them in the comments below.

And if you haven’t already done so, look for me on Twitter for more items of interest throughout the week.

Saturday Matinee: The Lunchbox

As I was writing yesterday’s post, I was reminded of a film I saw on DVD a few months ago.  The movie was called The Lunchbox and it told the story of an unhappy housewife, hoping to revive her marriage, and a widower nearing retirement, who form an unexpected connection when Mumbai’s lunchbox delivery service mistakenly starts delivering the lunches meant for her husband to the older man’s office, instead.

I thought of the movie because essentially the lunchbox delivery service–known as the Dabbawala–poses a massive logistics and operations problem, delivering 400,000 lunchboxes each day from homes to offices all across the massive and crowded city.  The Dabbawala service has been held up as an example by the Harvard Business Review as a model of service excellence and NBC News has described it as the envy of Federal Express.  In the movie, when the housewife, Ila, contacts the service to complain that her husband’s lunchbox is being delivered to the wrong person, the person with whom she speaks insists that she must be mistaken, that the service is highly efficient, and was even the subject of a case study at Harvard Business School.

Given the high accuracy and success of the Dabbawala system, such a mistake happening over and over again seems very unlikely, and yet it makes for a good story.   Ila is a very talented cook, and over the course of the story, the man, whose name is Saajan Fernandes, looks forward to the amazing meals he will find in the lunchbox.  The two begin exchanging letters where they talk about their lives.

As they form an unlikely connection, Ila muses about the happenstance that has led them to communicate with each other in this way: “Sometimes the wrong train will get you to the right station” (a bit of folk wisdom which is repeated by Fernandes’ young colleague later in the film).

At another point, Saajan Fernandes makes an even more poignant observation when he notes that “I think we forget things if we have no one to tell them to.”

And that brings me to my questions of the day.  Have you ever found that the “wrong train” got you to the right destination?  Maybe you were doing something wrong for a long time and despite that you found what you were looking for?  We talk often about learning from mistakes, but I wonder what we learn when we don’t realize we are making a mistake and yet we still, somehow, manage to find the right answers?

Or, on the other hand, are there things you have learned that you worry about forgetting if you have no one to tell them to?